Candlestick charts are the most common way traders visualize price action, and once you learn to read them, they reveal a surprising amount of information at a glance. Each candle tells a small story about the battle between buyers and sellers. This practical guide explains how candlesticks work, which patterns are worth knowing and how to use them sensibly in crypto markets.
What Is a Candlestick Chart?
A candlestick chart plots price over time, with each “candle” representing a fixed period, such as one minute, one hour or one day. That period is called the timeframe.
Unlike a simple line chart, which only connects closing prices, a candlestick shows four key data points for each period. This gives you a much richer picture of how price moved within that window.
The technique dates back centuries to Japanese rice traders and is now standard on almost every trading platform, including crypto exchanges. If you are brand new, our complete beginner’s guide to crypto trading shows where chart reading fits into the bigger picture.
The Anatomy of a Candle
Every candle is built from four prices, often abbreviated as OHLC:
- Open: the price at the start of the period.
- High: the highest price reached during the period.
- Low: the lowest price reached during the period.
- Close: the price at the end of the period.
The Body
The thick rectangular part of the candle is the body. It spans the distance between the open and the close. A long body signals strong momentum in one direction, while a short body suggests indecision or a quiet market.
The Wicks (or Shadows)
The thin lines above and below the body are called wicks or shadows. The upper wick reaches the high, and the lower wick reaches the low. Long wicks show that price traveled far but was pushed back before the period closed.
Colors: Bullish vs. Bearish
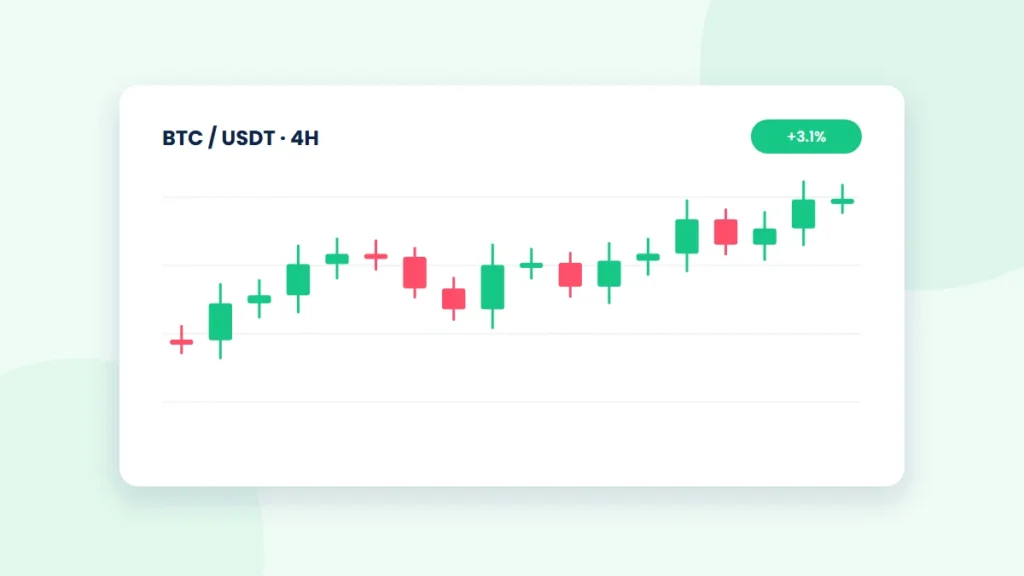
Most platforms use green for bullish candles, where the close is higher than the open, and red for bearish candles, where the close is lower than the open. Some charts use hollow and filled candles instead, and many let you customize the colors.
Choosing the Right Timeframe
The same market can look completely different depending on the timeframe you choose. A strong downtrend on a 15-minute chart might be a minor dip on a daily chart.
| Timeframe | Typical User | What It Shows |
|---|---|---|
| 1m – 15m | Scalpers and day traders | Short-term noise and intraday entries |
| 1h – 4h | Day and swing traders | Short-term trends and key intraday levels |
| Daily | Swing traders and investors | The broader trend and major support or resistance |
| Weekly | Long-term investors | Big-picture market structure and market cycles |
A useful habit is top-down analysis: start on a higher timeframe to understand the overall trend, then zoom in to a lower timeframe to fine-tune your entries and exits.
Single-Candle Patterns Worth Knowing
Some individual candles carry meaningful signals, especially when they appear at important price levels.
Doji
A doji has an open and close that are nearly identical, creating a very thin body with wicks on one or both sides. It represents indecision. After a strong trend, a doji can hint that momentum is fading.
Hammer and Hanging Man
Both have a small body near the top of the candle and a long lower wick, at least twice the length of the body. After a downtrend, it is called a hammer and may signal that buyers are stepping in. After an uptrend, the same shape is called a hanging man and can warn of weakening demand.
Shooting Star and Inverted Hammer
These have a small body near the bottom and a long upper wick. A shooting star appears after an uptrend and suggests sellers rejected higher prices. An inverted hammer appears after a downtrend and may hint at a possible reversal upward.
Marubozu
A marubozu is a long candle with little or no wick. A green marubozu shows buyers in control from open to close, while a red one shows sellers dominated the entire period.
Multi-Candle Patterns
Patterns made of two or three candles often provide stronger signals because they show a shift in control over time.
- Bullish engulfing: a small red candle followed by a larger green candle whose body fully covers the previous body. It suggests buyers have overpowered sellers.
- Bearish engulfing: the opposite, where a large red body engulfs the prior green body, hinting at a possible top.
- Morning star: a three-candle bullish reversal made of a long red candle, a small indecisive candle and a strong green candle.
- Evening star: the bearish mirror image of the morning star, often seen near the end of an uptrend.
- Three white soldiers / three black crows: three consecutive strong candles in the same direction, signaling sustained momentum.
A pattern on its own is a clue, not a guarantee. Context, location and confirmation matter far more than the shape itself.
How to Use Candlesticks in Practice
Candlestick patterns work best as part of a broader approach rather than as standalone buy or sell signals. Here is a simple framework many traders follow:
- Identify the trend. Use a higher timeframe to see whether the market is trending up, trending down or moving sideways.
- Mark key levels. Draw support and resistance zones where price has reacted before.
- Watch for patterns at those levels. A hammer at strong support carries more weight than a hammer in the middle of nowhere.
- Look for confirmation. Wait for the next candle, rising volume or an indicator such as RSI to support the signal.
- Plan your risk. Decide on your stop-loss and position size before entering the trade.
Common Mistakes to Avoid
- Trading every pattern you see without considering the bigger trend.
- Ignoring volume, which helps confirm whether a move has real conviction.
- Reading too much into very low timeframes, where random noise dominates.
- Acting before the candle has closed, since its shape can change dramatically until then.
Crypto markets trade around the clock and can be highly volatile, so patterns may fail more often than textbooks suggest. Overtrading weak setups is one of the most common crypto trading mistakes. Nothing here is financial advice, so always manage your risk carefully. Investor.gov also outlines key risks of crypto assets.
If you trade on Bithoex.com, try practicing on the charts by switching between timeframes and marking the patterns you spot. For deeper dives into indicators and trends, explore our market analysis section.
Frequently Asked Questions
Are candlestick patterns reliable for crypto trading?
They can be useful, but no pattern works every time. Their reliability improves when they appear at key support or resistance levels, line up with the broader trend and are confirmed by volume or other indicators.
What is the best timeframe for beginners?
Many beginners find the 4-hour and daily charts easiest to learn on. They filter out much of the short-term noise and give you more time to think before making decisions.
Do I need indicators if I read candlesticks?
Not necessarily, but indicators such as moving averages, RSI and volume can add helpful confirmation. Many traders combine price action with one or two simple indicators rather than cluttering their charts.
Final Thoughts
Learning to read candlestick charts is one of the most valuable skills a trader can build. Start with the anatomy of a single candle, learn a handful of key patterns and always read them in context. With practice, whether on Bithoex.com or any chart you use, price action will start to feel less like noise and more like a story you can follow.